AI Image Generator for Scientific Figures: Concept Diagrams in Minutes
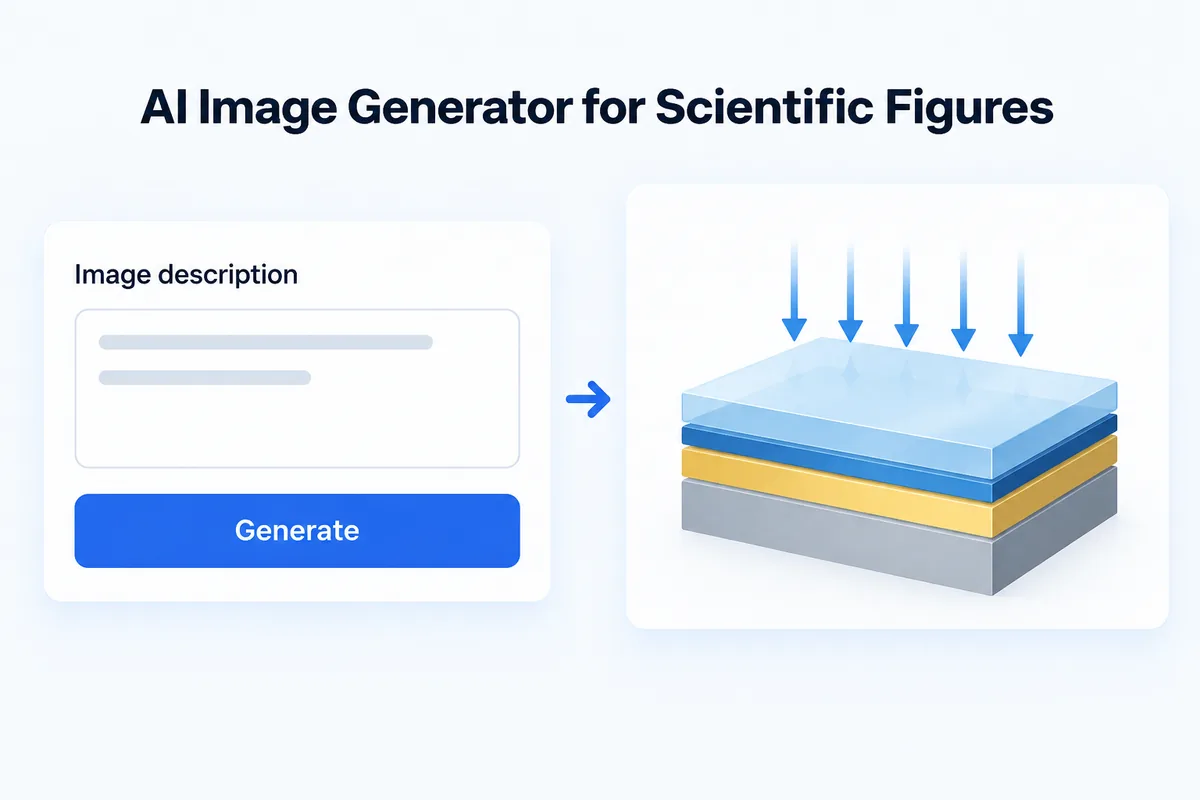
An AI image generator for scientific figures turns one sentence into a concept diagram — a process flow, a layered structure, a mechanism sketch or a visual abstract. It is for figures that explain an idea, not for figures that report data. In HanFlow AI you describe the figure, pick a style, check the labels and drop it into your slides.
Describe the figure in one sentence
Open AI images and stay on the Generate images tab. Type into Image description what the figure should show.
A useful description has three parts: the subject, the layout and the labels. For example: "Cross-section of a battery cell, cathode on the left, anode on the right, electrolyte in the middle, arrows for ion flow, a label on each layer." Keep it to one figure and one message.
Pick a style and pin it
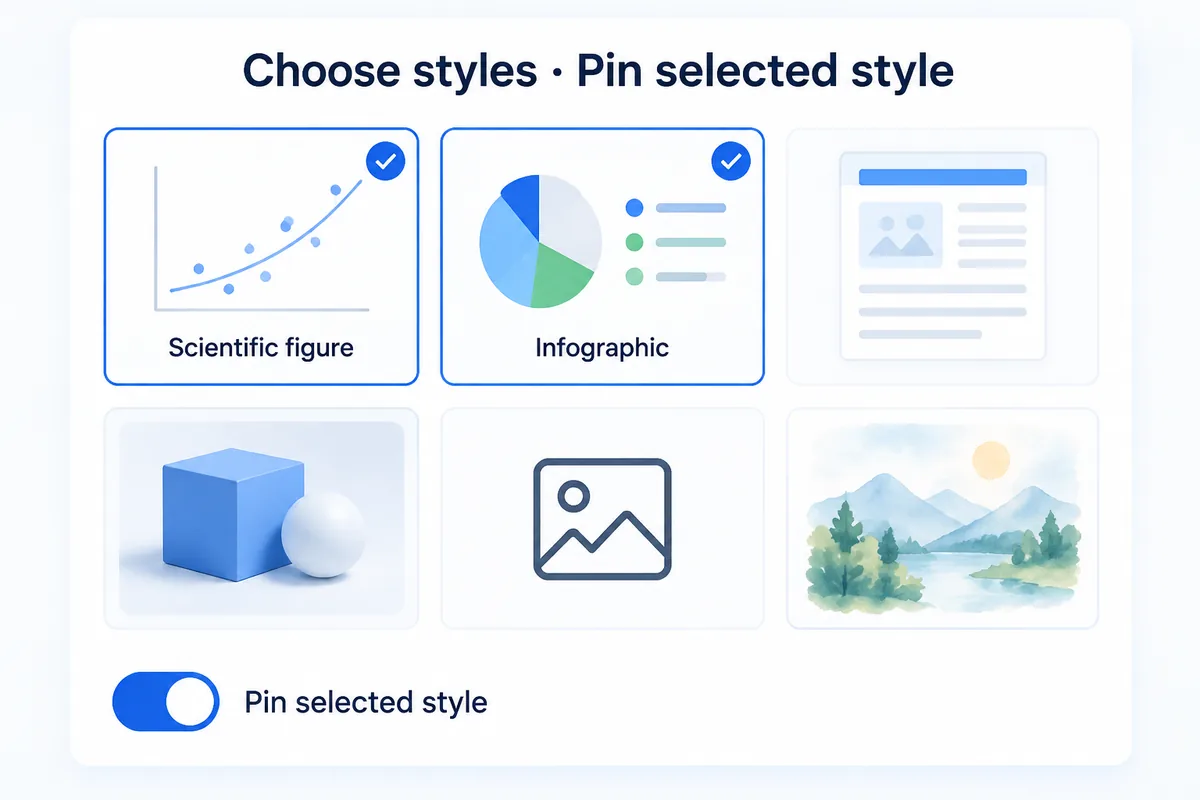
Below the description, the Choose styles gallery holds more than 1,000 styles — scientific figures, infographics, document layouts and more. You can select several at once.
If you are making a set of figures for one paper or talk, turn on Pin selected style. Every new image keeps the same look until you switch it off, so Figure 1 and Figure 4 match.
Set background, ratio and text
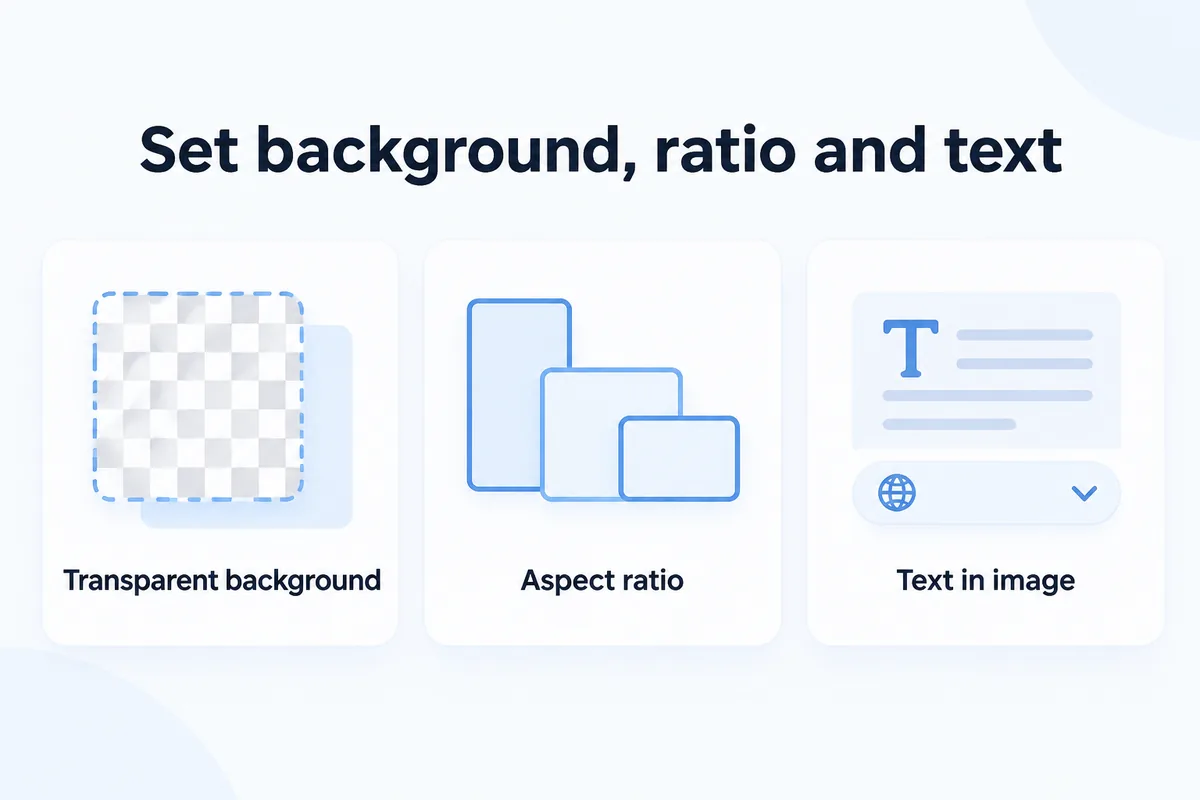
Figures usually sit on a slide or a page, so a plain box behind them looks wrong. Choose Transparent background, or leave it on AI auto, which keeps illustrations and icons transparent and photo-like images opaque.
Pick the aspect ratio for where the figure will go — wide for a process flow, tall for a poster panel. If the figure needs words inside it, choose the language under Text in image.
Turn a whole document into one figure
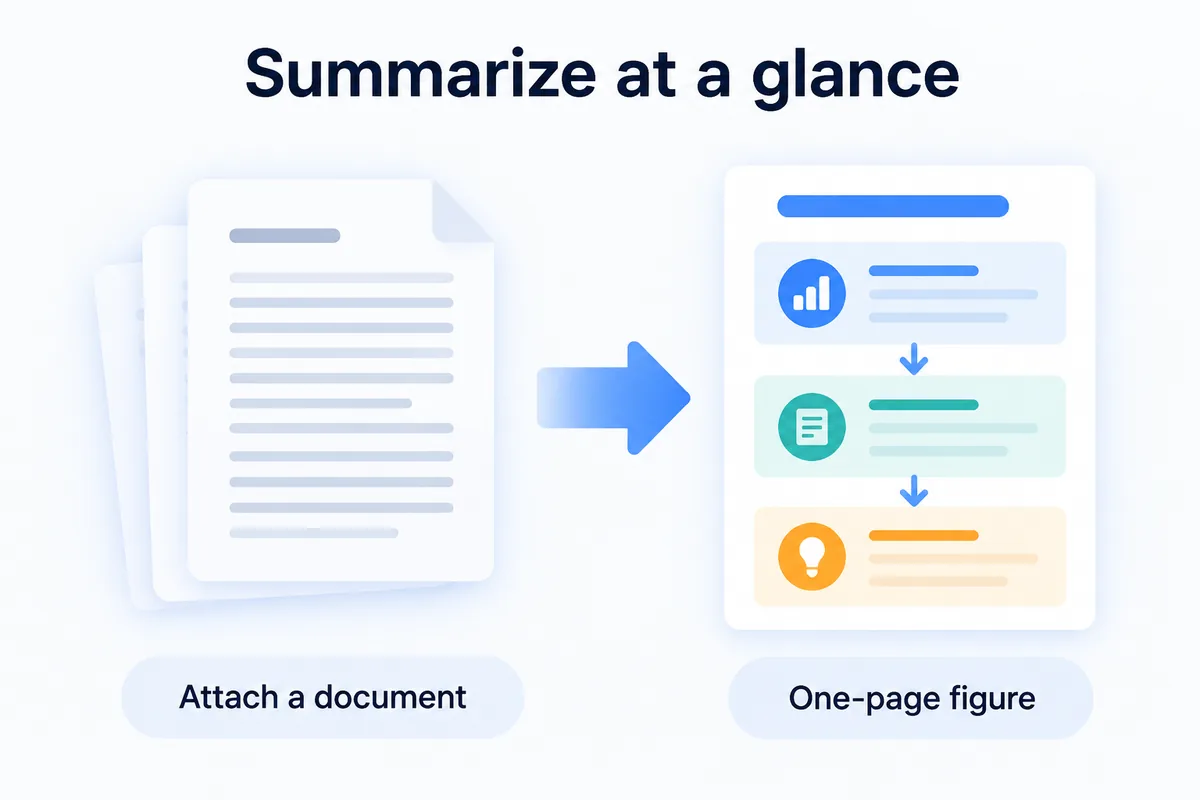
You do not have to write a prompt at all. Attach a document and the generator works from its content. Switch to Summarize at a glance and it condenses the whole document into a single one-page figure — handy for a graphical abstract or the opening slide of a talk.
To merge a reference picture with a new instruction, use the Image compositing tab.
Fix the labels, then place it
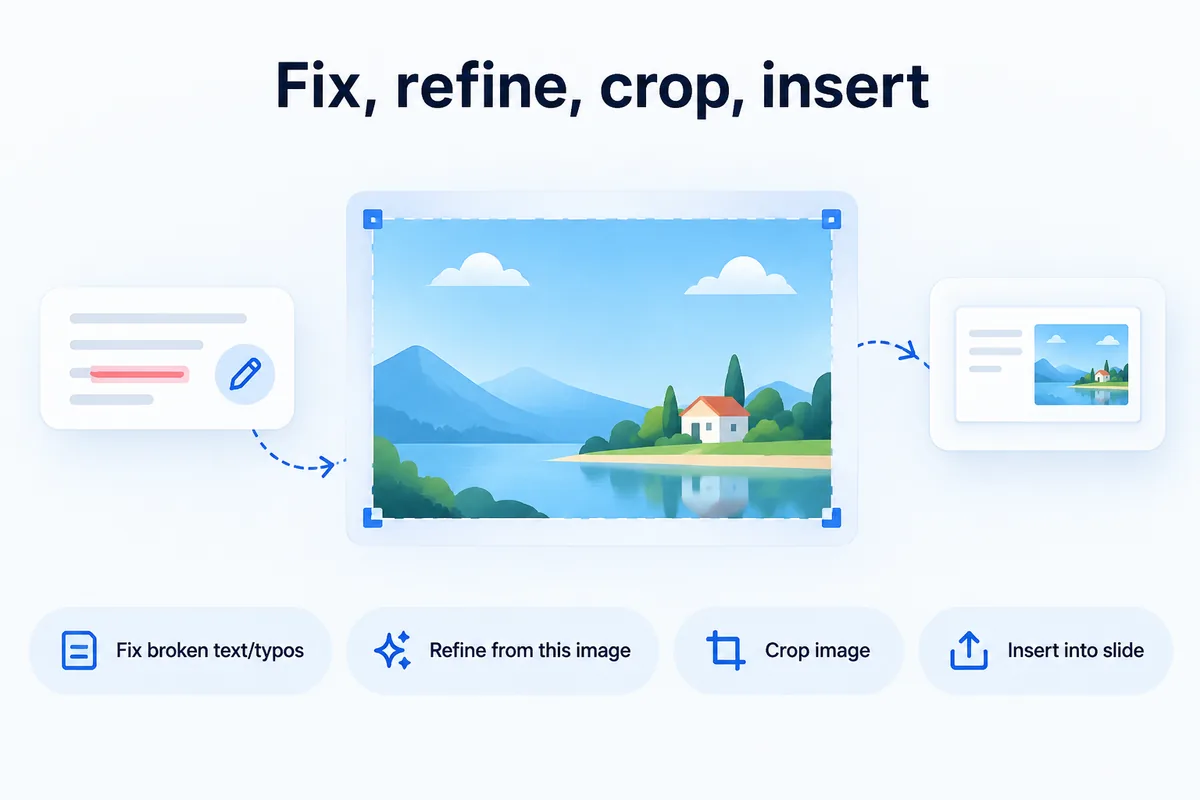
AI-drawn text is the part most likely to go wrong. On the result, press Fix broken text/typos and the garbled or misspelled labels are redrawn. Refine from this image lets you give a follow-up instruction without starting over, and Crop image cuts out just the part you need.
When it looks right, Download PNG, copy it to the clipboard, or Insert into slide to send it straight into the HanFlow AI slide editor. Generated images are also kept in your workspace assets. Depending on quality, one image takes about one to three minutes.
Diagrams yes, data no
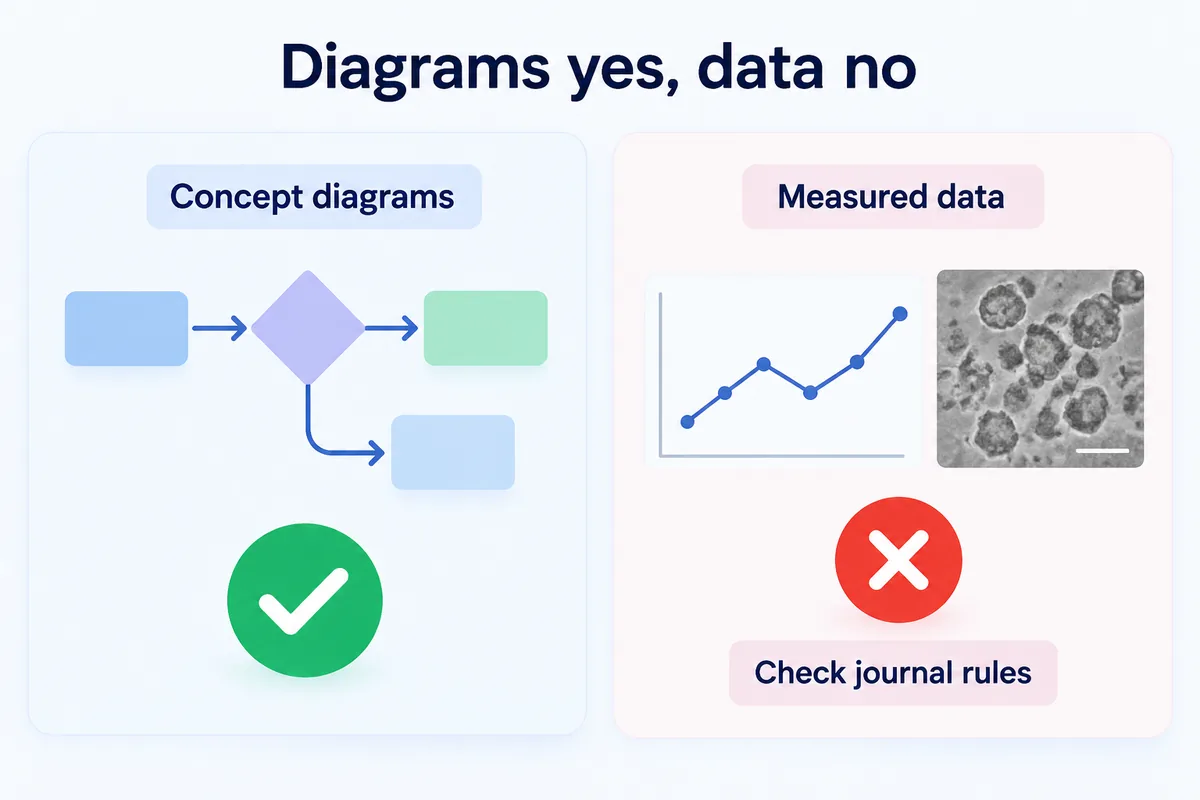
AI images belong in the parts of a paper that explain: concept diagrams, workflows, mechanism sketches, visual abstracts. They must never stand in for measured results — no generated micrographs, no generated plots, no "cleaned up" experimental photos. Altering evidence is a research-integrity problem, not a style choice.
Many journals also have their own rules on generative images, including disclosure. Read your target journal's policy before you submit. And check every label, arrow direction and unit against your manuscript — the tool draws what you described, not what your data says.
HanFlow AI runs in your browser — nothing to install. If the figure is headed for a talk, see how to build a slide deck next.
Frequently asked questions
Can I use AI-generated figures in a peer-reviewed paper?
For conceptual illustrations such as process diagrams or graphical abstracts, often yes — but journal policies differ, and some require disclosure. Never use AI to create or alter images that carry data. Check the journal's guidelines before submitting.
How do I keep the same style across several figures?
Select a style in Choose styles and turn on Pin selected style. Every new image uses that style until you turn it off, so a whole figure set looks consistent.
What if the text inside the figure is wrong?
Press Fix broken text/typos on the result and the broken or misspelled labels are redrawn. Then compare each label and unit with your manuscript before you use the figure.
Can it draw a chart from my dataset?
No. It makes illustrative diagrams, not plots of measured data. Use your plotting tool for anything that comes from your results.